THE TEST
A drive on rollers
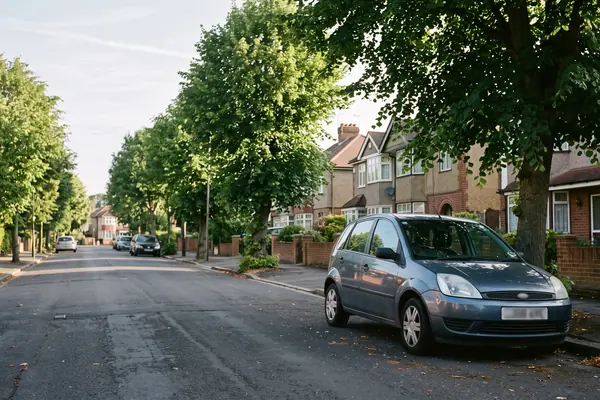
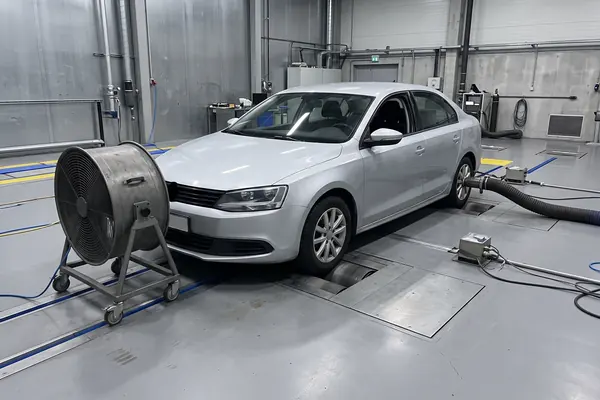
Each car is run over a fixed route on a rolling road in a laboratory under closely controlled conditions, says the Vehicle Certification Agency.
See the test econospecs
00WHAT THE OFFICIAL FIGURES MEAN

Every new car's fuel figure comes from the same lab test.
Since 2017 the official mpg and CO2 numbers have come from WLTP, a 30-minute drive on a rolling road. The figures are made for comparing cars fairly, not for predicting your own fuel bill, and EU data shows how big the gap usually is.
Check the gap01Principles
02THE SHORT ANSWER
Official figures come from a laboratory.
That makes them comparable, and a little optimistic.
THE TEST
Each car is run over a fixed route on a rolling road in a laboratory under closely controlled conditions, says the Vehicle Certification Agency.
See the testTHE LABEL
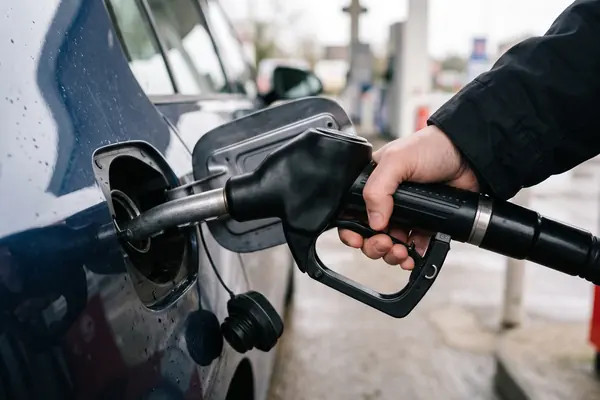
Dealers must show a label on or near every new car for sale. It gives fuel use in litres per 100 km and in mpg, plus CO2 in grams per km.
Read a labelTHE GAP
EU on-board data found petrol and diesel cars on the road use around 20% more fuel than their official WLTP figures.
Check the gap03A QUICK GAP CHECK
Pick a type of car to see how its real-world fuel use compared with its official WLTP figure in EU on-board monitoring data. The bar shows how big the gap was.
Averages across many cars. Your own car can do better or worse depending on how and where it is driven.
04TWO NUMBERS WORTH KNOWING
One figure on the official test,
one on how real driving compares.
23.25 km
Length of one test drive
The WLTP cycle lasts 30 minutes over 23.25 km, with an average speed of 46.5 km/h and a top speed of 131 km/h. The old NEDC test covered 11 km in 20 minutes.
THE WLTP CYCLE · ACEA
≈ 20% higher
Petrol and diesel cars, road vs label
On-board fuel monitors in millions of cars showed real-world CO2 and fuel use around 20% higher than the official WLTP values, a gap the Commission had expected.
REAL WORLD · EUROPEAN COMMISSION
The Commission says the gap comes from things a laboratory cannot fully copy: traffic and road conditions, landscape, outside temperature, air-conditioning and on-board electronics, and driver behaviour.
05FOUR WAYS TO USE THE FIGURES
Official figures are most useful side by side. These habits come from what the VCA and the European Commission say the numbers can and cannot tell you.
Use the official figures to compare models of a similar type. They come from the same lab test, so they are a fair like-for-like guide.
On the label, a lower l/100 km or g/km figure is better, and a higher mpg figure is better. They describe the same result.
The VCA says it is not advisable to rank cars whose figures are very similar. Small differences may vanish on the road.
For petrol and diesel cars, real-world use averaged around a fifth above the label. With a plug-in hybrid, regular charging matters most.
06WHY WLTP REPLACED NEDC
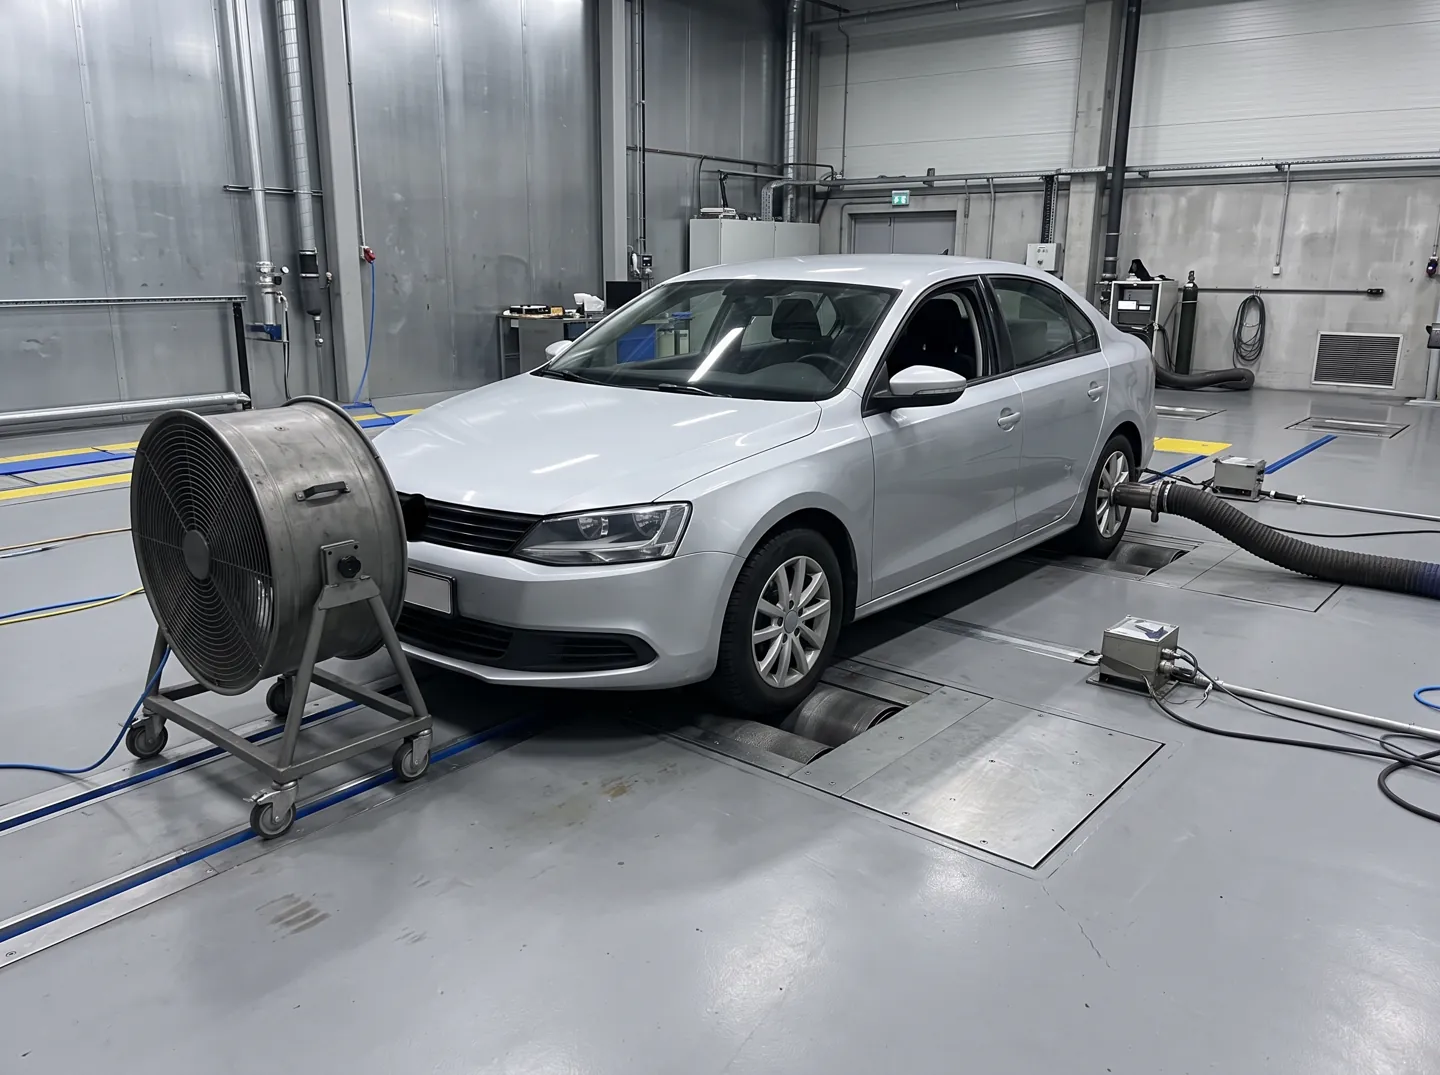
The older NEDC test was designed in the 1980s and followed a theoretical driving profile. WLTP was developed from real-driving data gathered around the world, with four phases called Low, Medium, High and Extra-high.
WLTP became the official test for new cars in September 2017 and mandatory for all new combustion-engine cars by September 2018. It also counts optional extras, and each car type is tested in its lightest and heaviest versions.
07Questions
The VCA says the standard tests cannot be fully representative of real-life driving, because driving styles, roads, the car itself and the weather all vary. EU data shows petrol and diesel cars use around 20% more on average.
Worldwide Harmonised Light Vehicle Test Procedure. It replaced the older NEDC test for official fuel consumption and CO2 figures for new cars from September 2017.
Dealers must display a label on or near every new car for sale, showing fuel consumption in l/100 km and mpg and CO2 emissions. Some cars, such as low-volume models, are excluded from the scheme.
The official figure assumes a share of electric driving. The European Commission found these cars are not charged and driven electrically as often as expected, so real-world CO2 averaged 3.5 times the official value.
The VCA suggests first checking your driving habits and tyre pressures. If consumption is still higher than you would expect, it says to ask an authorised dealer or other competent organisation to examine the car.
08Sources
ABOUT THIS NAME
econospecs.com is part of the DoodleSale portfolio. It isn't in an auction right now, but you can ask about leasing it.